Market Outlook
August 31, 2017
Market Cues
Domestic Indices
Chg (%)
(Pts)
(Close)
Indian markets are likely to open flat tracking global indices and SGX Nifty.
BSE Sensex
0.8
258
31,646
U.S. market indexes closed higher Wednesday, with the benchmark S&P 500 posting
Nifty
0.9
88
9,884
gains for a fourth straight session after a pair of strong economic reports.
Mid Cap
1.5
228
15,506
The European markets rebounded Wednesday, following yesterday's sell-off.
Small Cap
1.4
212
15,868
Markets dropped yesterday after North Korea fired a missile over Japan. However,
Bankex
0.8
214
27,476
concerns over potential instability in the region have relaxed after U.S. President
Donald Trump's measured response to the launch.
Global Indices
Chg (%)
(Pts)
(Close)
Indian markets rebounded on Wednesday, tracking firm cues from Asia and Europe,
Dow Jones
0.1
27
21,892
as jitters over North Korea eased somewhat. Investors were relieved by U.S.
Nasdaq
1.1
66
6,368
President Donald Trump's measured response to North Korea's missile launch and
FTSE
0.4
28
7,365
comments from the rogue state's leader Kim Jong Un that the launch of an
Nikkei
0.7
144
19,507
intermediate-range ballistic missile over Japan was to counter U.S. and South
Korean military drills.
Hang Seng
1.2
330
28,095
Shanghai Com
(0.0)
(2)
3,364
News Analysis
Inox Wind bags order for 100 MW project from Adani Green Energy in Gujarat
Advances / Declines
BSE
NSE
Detailed analysis is on Pg2
Advances
1,813
1,261
Declines
780
399
Investor’s Ready Reckoner
Unchanged
128
73
Key Domestic & Global Indicators
Stock Watch: Latest investment recommendations on 150+ stocks
Volumes (` Cr)
Refer Pg7 onwards
BSE
2,479
Top Picks
NSE
23,267
CMP
Target
Upside
Company
Sector
Rating
(`)
(`)
(%)
Blue Star
Capital Goods
Accumulate
754
760
0.7
#Net Inflows (` Cr)
Net
Mtd
Ytd
Dewan Housing FinanceFinancials
Accumulate
503
520
3.3
FII
219
(11,650)
46,746
Mahindra Lifespace
Real Estate
Buy
433
522
20.6
MFs
447
15,474
66,420
Navkar Corporation
Others
Buy
195
265
36.1
KEI Industries
Capital Goods
Accumulate
260
290
11.8
More Top Picks on Pg5
Top Gainers
Price (`)
Chg (%)
Bfutilitie
372
14.8
Key Upcoming Events
Previous
Consensus
Jpassociat
24
12.5
Date
Region
Event Description
Reading
Expectations
Bomdyeing
104
11.5
Aug 31, 2017 Germany Unemployment change (000's)
(8.00)
(6.00)
Ujjivan
358
10.2
Aug 31, 2017 US
Initial Jobless claims
234.00
238.00
Adanipower
32
8.4
Aug 31, 2017 China
PMI Manufacturing
51.40
51.30
Sep 01, 2017 US
Unnemployment rate
4.30
4.30
Sep 01, 2017 Germany PMI Manufacturing
59.40
59.40
Top Losers
Price (`)
Chg (%)
More Events on Pg7
Mindtree
463
(1.7)
Religare
54
(1.7)
Carerating
1,515
(1.5)
Aiaeng
1,287
(1.4)
Syngene
442
(1.4)
#as on 30th Aug, 2017
Market Outlook
August 31, 2017
News Analysis
Inox Wind bags order for 100 MW project from Adani Green Energy in
Gujarat
Wind turbine maker Inox Wind on Wednesday said it had bagged an order from
Adani Green Energy to develop a 100 MW wind power project in Gujarat.
The company has closed a deal for developing a 100 MW wind power project for
Adani Green Energy, a part of the Adani group at Kutch in Gujarat.
"The capacity was won under the round 1 of SECI bids for wind power projects
connected on the central grid. The project is scheduled to be executed over the
next 6-9 months and will be executed on a turnkey basis".
Inox Wind said as part of the order it will supply, erect and commission 50 units of
its 2MW wind turbine generators.
Economic and Political News
RBI annual report: 99% of demonetised currency back with central bank
Govt rules out cutting taxes on petrol, diesel
Rural development ministry seeks `17,000cr more for MGNREGS
India's GDP growth to remain 'soft' at 6% in Apr-Jun quarter: HSBC
Corporate News
NTPC signs `3,000cr term loan agreement with ICICI Bank
Wipro gets shareholders approval for `11,000cr buyback proposal
Zydus Cadila gets USFDA nod for drug used to reduce risk of strokes
SUVs, luxury cars to cost more as Cabinet clears cess hike
Market Outlook
August 31, 2017
Top Picks
Market Cap
CMP
Target
Upside
Company
Rationale
(` Cr)
(`)
(`)
(%)
Strong growth in domestic business due to its leadership
in acute therapeutic segment. Alkem expects to launch
Alkem Laboratories
21,230
1,776
2,161
21.7
more products in USA, which bodes for its international
business.
We expect the company would report strong profitability
Asian Granito
1,324
440
480
9.1
owing to better product mix, higher B2C sales and
amalgamation synergy.
Favorable outlook for the AC industry to augur well for
Cooling products business which is out pacing the
Blue Star
7,224
754
760
0.7
market growth. EMPPAC division's profitability to improve
once operating environment turns around.
With a focus on the low and medium income (LMI)
consumer segment, the company has increased its
Dewan Housing Finance
15,784
503
520
3.3
presence in tier-II & III cities where the growth
opportunity is immense.
Loan growth is likely to pick up after a sluggish FY17.
Karur Vysya Bank
8,539
141
160
13.2
Lower credit cost will help in strong bottom-line growth.
Increasing share of CASA will help in NIM improvement.
High order book execution in EPC segment, rising B2C
KEI Industries
2,019
260
290
11.8
sales and higher exports to boost the revenues and
profitability
Speedier execution and speedier sales, strong revenue
Mahindra Lifespace
2,222
433
522
20.6
visibility in short-to-long run, attractive valuations
Expected to benefit from the lower capex requirement
Music Broadcast
2,128
373
434
16.4
and 15 year long radio broadcast licensing.
Massive capacity expansion along with rail advantage at
Navkar Corporation
2,777
195
265
36.1
ICD as well CFS augurs well for the company
Strong brands and distribution network would boost
Siyaram Silk Mills
2,058
2,196
2,500
13.9
growth going ahead. Stock currently trades at an
inexpensive valuation.
Market leadership in Hindi news genre and no.
2
viewership ranking in English news genre, exit from the
TV Today Network
1,450
243
344
41.6
radio business, and anticipated growth in ad spends by
corporates to benefit the stock.
After GST, the company is expected to see higher
volumes along with improving product mix. The Gujarat
Maruti Suzuki
2,28,660
7,570
8,544
12.9
plant will also enable higher operating leverage which
will be margin accretive.
Source: Company, Angel Research
Market Outlook
August 31, 2017
Key Upcoming Events
Global economic events release calendar
Bloomberg Data
Date
Time
Country
Event Description
Unit
Period
Last Reported
Estimated
Aug 31, 2017
1:25 PMGermany
Unemployment change (000's)
Thousands
Aug
(8.00)
(6.00)
6:00 PMUS
Initial Jobless claims
Thousands
Aug 26
234.00
238.00
6:30 AMChina
PMI Manufacturing
Value
Aug
51.40
51.30
Sep 01, 2017
6:00 PMUS
Unnemployment rate
%
Aug
4.30
4.30
1:25 PMGermany
PMI Manufacturing
Value
Aug F
59.40
59.40
6:00 PMUS
Change in Nonfarm payrolls
Thousands
Aug
209.00
180.00
2:00 PMUK
PMI Manufacturing
Value
Aug
55.10
55.00
Sep 05, 2017
1:25 PMGermany
PMI Services
Value
Aug F
53.40
2:30 PMEuro Zone
Euro-Zone GDP s.a. (QoQ)
% Change
2Q F
0.60
Sep 07, 2017
5:15 PMEuro Zone
ECB announces interest rates
%
Sep 7
-
Sep 08, 2017
India
Imports YoY%
% Change
Aug
15.40
India
Exports YoY%
% Change
Aug
3.94
2:00 PMUK
Industrial Production (YoY)
% Change
Jul
0.30
China
Exports YoY%
% Change
Aug
7.20
Sep 09, 2017
7:00 AMChina
Consumer Price Index (YoY)
% Change
Aug
1.40
Sep 12, 2017
5:30 PMIndia
Industrial Production YoY
% Change
Jul
(0.10)
2:00 PMUK
CPI (YoY)
% Change
Aug
2.60
Sep 13, 2017
2:00 PMUK
Jobless claims change
% Change
Aug
(4.20)
US
Producer Price Index (mom)
% Change
Aug
(0.20)
Sep 14, 2017
7:30 AMChina
Industrial Production (YoY)
% Change
Aug
6.40
12:00 PMIndia
Monthly Wholesale Prices YoY%
% Change
Aug
1.88
6:00 PMUS
Consumer price index (mom)
% Change
Aug
0.10
0.30
Source: Bloomberg, Angel Research
Market Outlook
August 31, 2017
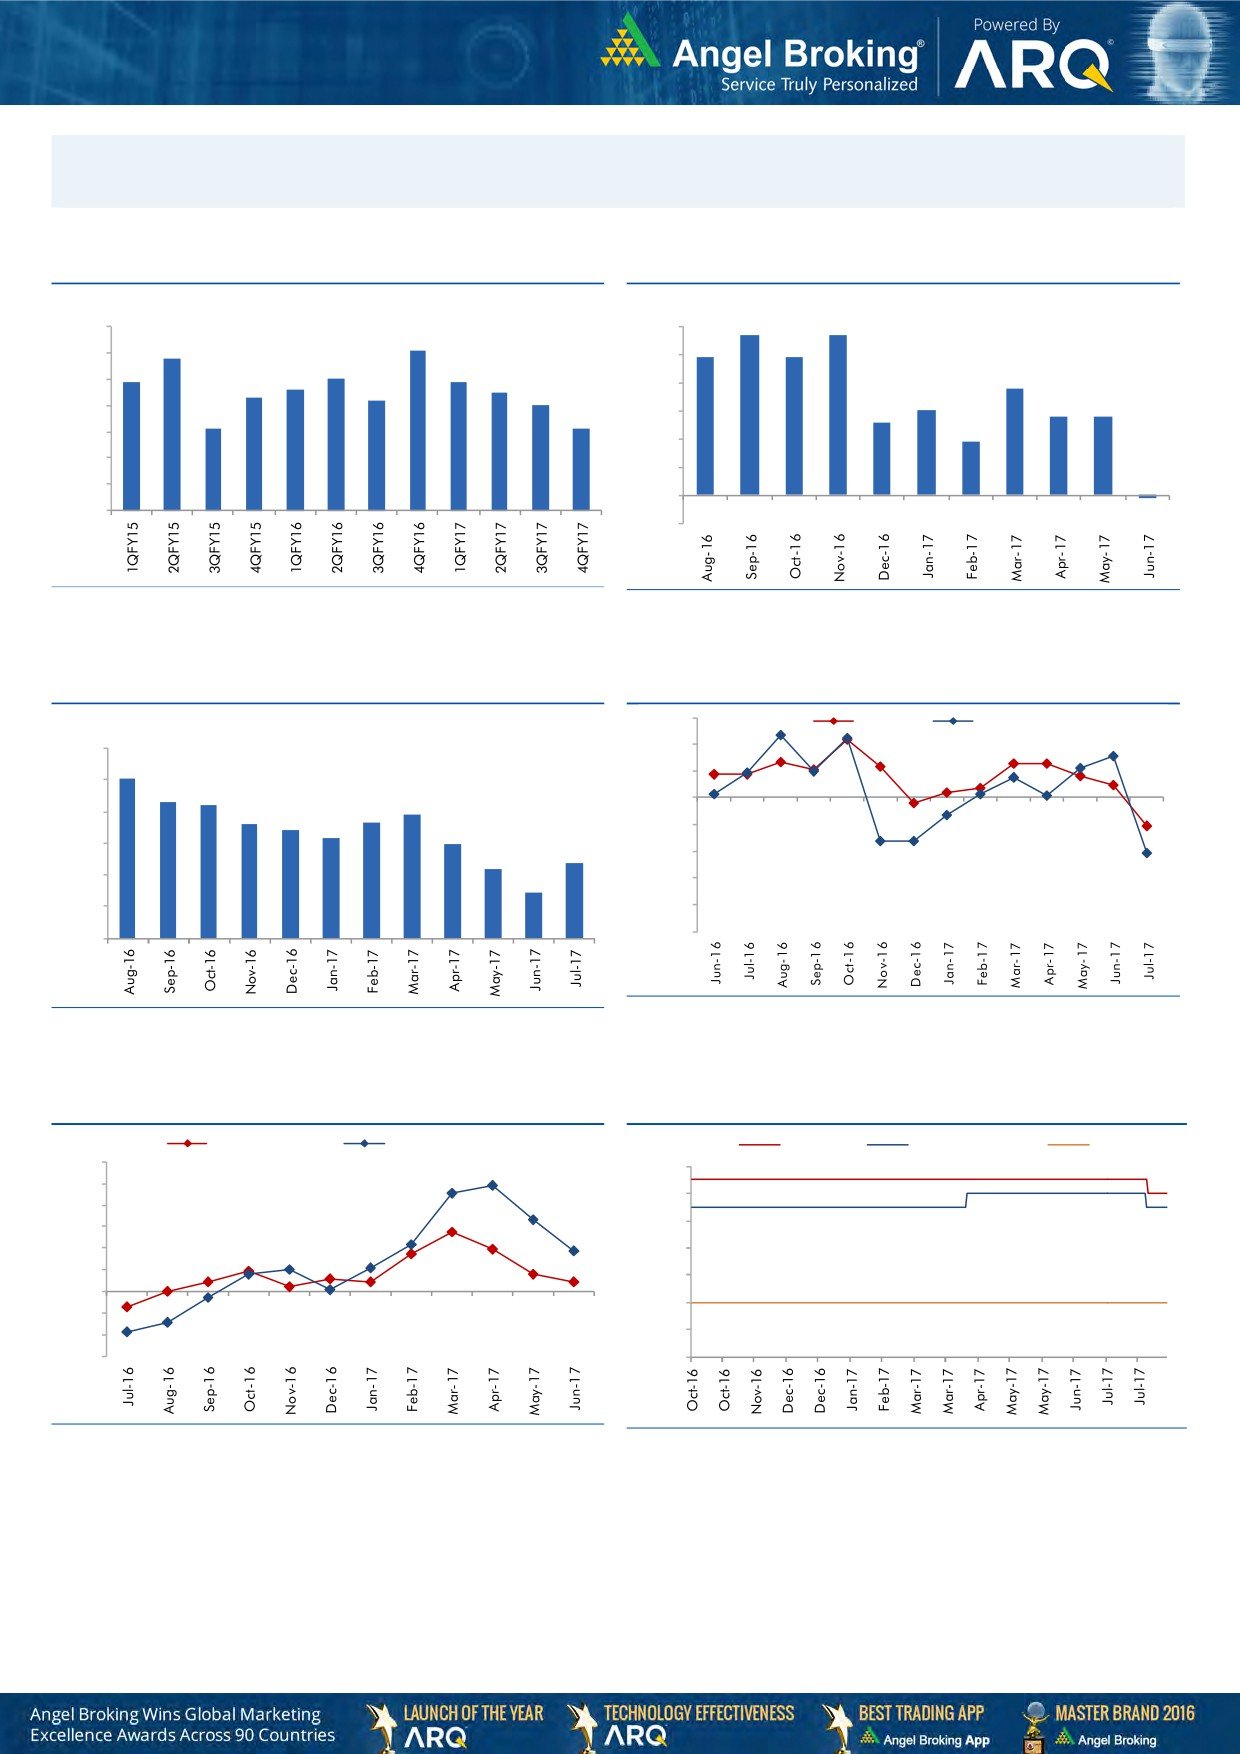
Macro watch
Exhibit 1: Quarterly GDP trends
Exhibit 2: IIP trends
(%)
(%)
5.7
5.7
10.0
6.0
9.1
8.8
4.9
4.9
9.0
5.0
7.9
8.0
7.9
7.6
7.5
3.8
8.0
7.3
7.2
4.0
7.0
3.0
2.8
2.8
7.0
2.6
6.1
6.1
3.0
1.9
6.0
2.0
5.0
1.0
4.0
-
3.0
(0.1)
(1.0)
Source: CSO, Angel Research
Source: MOSPI, Angel Research
Exhibit 3: Monthly CPI inflation trends
Exhibit 4: Manufacturing and services PMI
56.0
Mfg. PMI
Services PMI
(%)
54.0
6.0
5.1
52.0
5.0
4.3
4.2
3.9
50.0
3.6
3.7
4.0
3.4
3.2
3.0
48.0
3.0
2.4
2.2
46.0
2.0
1.5
44.0
1.0
42.0
40.0
-
Source: Market, Angel Research; Note: Level above 50 indicates expansion
Source: MOSPI, Angel Research
Exhibit 5: Exports and imports growth trends
Exhibit 6: Key policy rates
(%)
Exports yoy growth
Imports yoy growth
(%)
Repo rate
Reverse Repo rate
CRR
60.0
6.50
50.0
6.00
40.0
5.50
30.0
20.0
5.00
10.0
4.50
0 .0
4.00
(10.0)
3.50
(20.0)
(30.0)
3.00
Source: Bloomberg, Angel Research
Source: RBI, Angel Research
Market Outlook
August 31, 2017
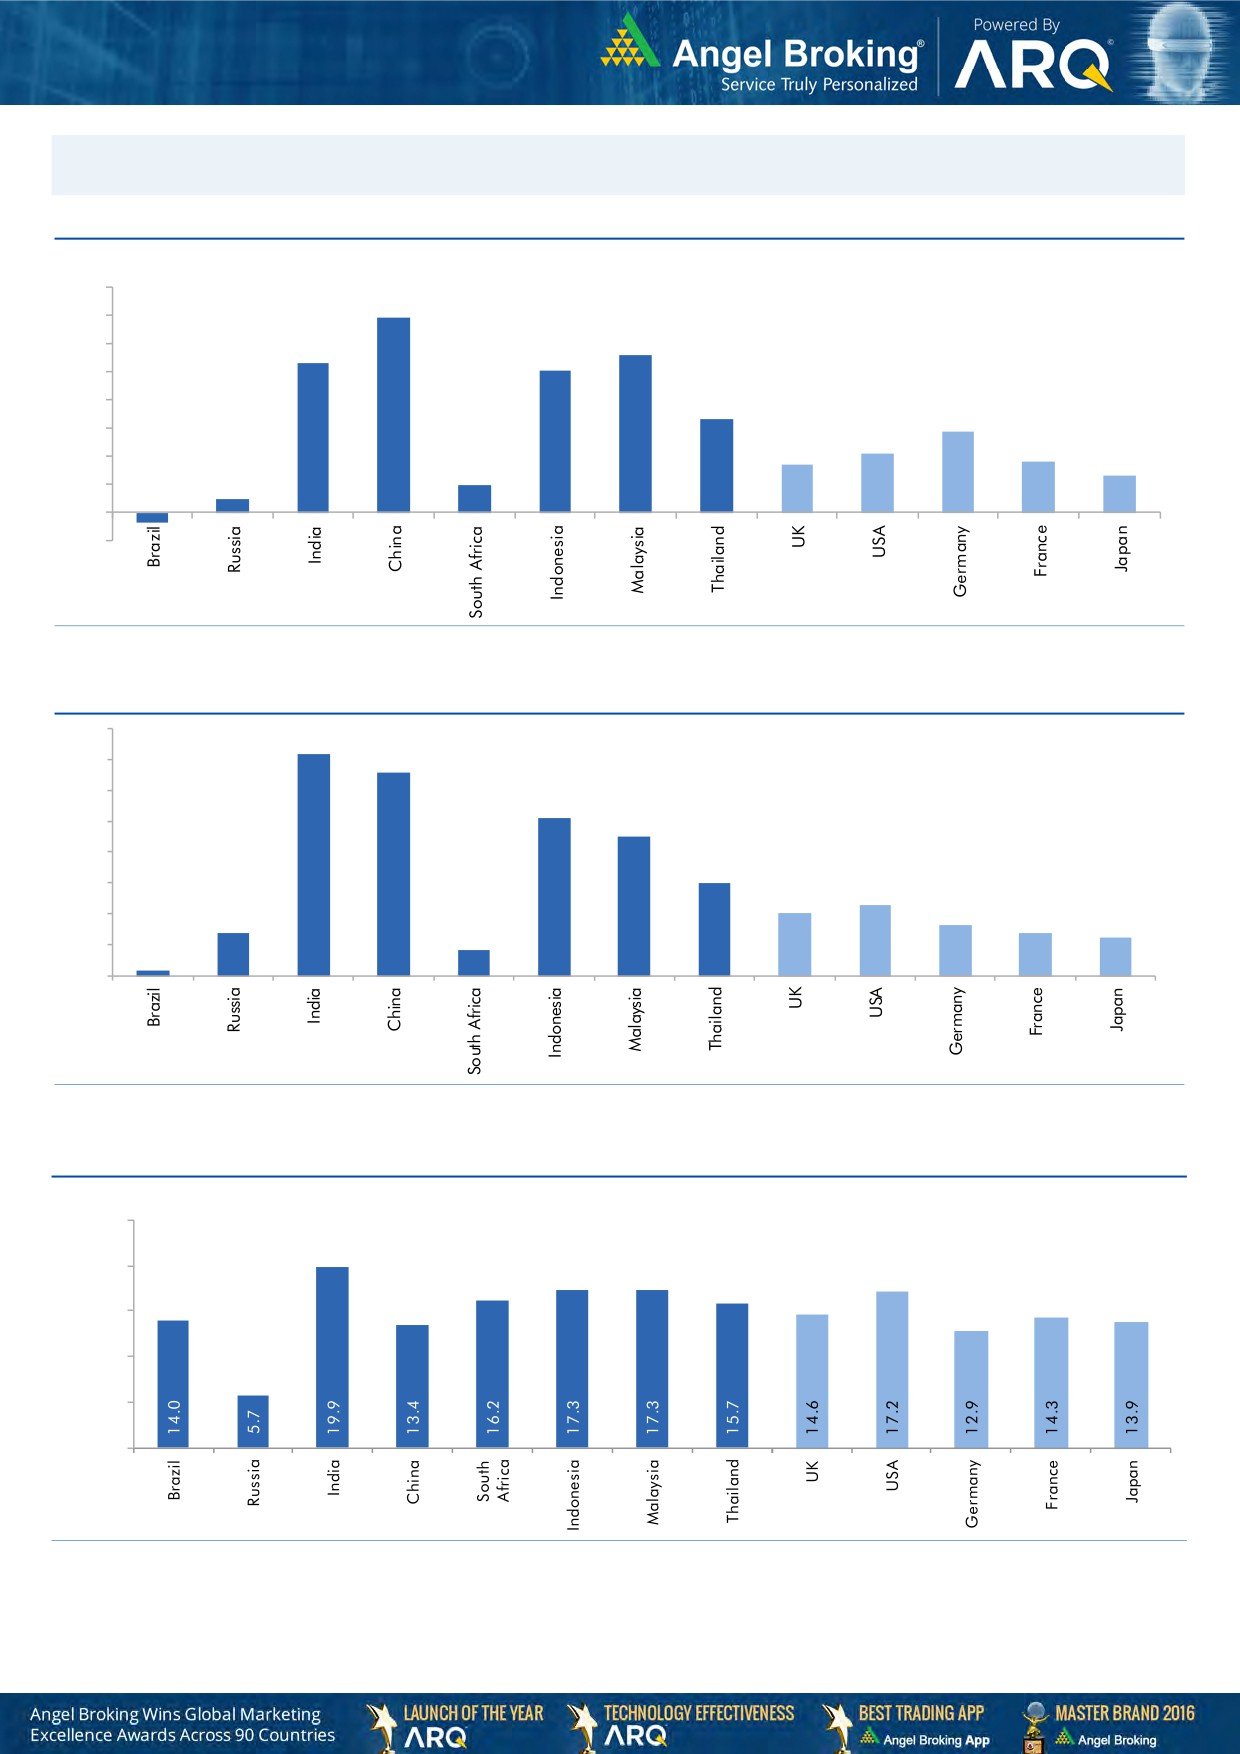
Global watch
Exhibit 1: Latest quarterly GDP Growth (%, yoy) across select developing and developed countries
(%)
8.0
6.9
7.0
5.6
6.0
5.3
5.0
1.0
5.0
4.0
3.3
2.9
3.0
2.1
0.5
1.7
1.8
2.0
1.3
1.0
-
(1.0)
(0.4)
Source: Bloomberg, Angel Research
Exhibit 2: 2016 GDP Growth projection by IMF (%, yoy) across select developing and developed countries
(%)
7.2
6.6
7.0
6.0
5.1
5.0
4.5
4.0
3.0
3.0
2.3
2.0
1.4
1.6
2.0
1.4
1.2
0.2
0.8
1.0
-
Source: IMF, Angel Research
Exhibit 3: One year forward P-E ratio across select developing and developed countries
(x)
25.0
20.0
15.0
10.0
5.0
-
Source: IMF, Angel Research
Market Outlook
August 31, 2017
Exhibit 4: Relative performance of indices across globe
Returns (%)
Country
Name of index
Closing price
1M
3M
1YR
Brazil
Bovespa
70,886
7.5
13.0
22.8
Russia
Micex
2,009
4.7
5.7
1.6
India
Nifty
9,884
(1.4)
2.9
14.3
China
Shanghai Composite
3,364
2.1
8.2
8.1
South Africa
Top 40
49,675
2.3
4.1
5.9
Mexico
Mexbol
51,194
0.4
4.3
7.7
Indonesia
LQ45
980
0.7
2.0
6.2
Malaysia
KLCI
1,773
0.7
0.5
5.4
Thailand
SET 50
1,035
2.7
4.3
4.9
USA
Dow Jones
21,892
0.0
4.2
19.0
UK
FTSE
7,365
(0.0)
(2.1)
9.2
Japan
Nikkei
19,507
(2.3)
(0.9)
18.2
Germany
DAX
12,002
(1.0)
(4.9)
12.5
France
CAC
5,056
(0.7)
(4.9)
10.9
Source: Bloomberg, Angel Research
Stock Watch
August 31, 2017
Company Name
Reco
CMP
Target
Mkt Cap
Sales ( Čcr )
OPM(%)
EPS (Č)
PER(x)
P/BV(x)
RoE(%)
EV/Sales(x)
(Č)
Price ( Č)
( Č cr )
FY18E FY19E
FY18E
FY19E
FY18E
FY19E
FY18E
FY19E
FY18E
FY19E
FY18E
FY19E
FY18E
FY19E
Agri / Agri Chemical
Rallis
Reduce
227
209
4,418
1,873
2,099
15.0
15.0
9.5
10.5
23.9
21.6
3.6
3.3
15.8
16.0
2.3
2.0
United Phosphorus
Neutral
842
-
42,751
18,922
21,949
18.0
18.5
36.2
45.6
23.3
18.5
4.9
4.0
22.7
23.8
2.4
2.0
Auto & Auto Ancillary
Ashok Leyland
Buy
107
124
31,402
23,339
27,240
10.1
10.8
4.7
6.2
23.1
17.3
4.6
4.1
20.0
23.6
1.3
1.1
Bajaj Auto
Accumulate
2,747
3,151
79,488
23,936
27,955
19.5
20.1
142.7
167.3
19.2
16.4
4.2
3.7
21.8
22.8
2.9
2.4
Bharat Forge
Neutral
1,143
-
26,613
7,637
8,755
21.7
23.2
36.1
47.3
31.7
24.2
5.7
4.8
18.5
20.8
3.3
2.8
Eicher Motors
Neutral
30,984
-
84,345
19,043
22,837
19.5
19.9
835.4
1,019.0
37.1
30.4
13.9
10.7
40.9
37.8
4.3
3.5
Gabriel India
Neutral
170
-
2,438
1,782
2,033
9.7
10.2
7.1
8.9
23.9
19.2
4.8
4.1
21.0
22.2
1.3
1.1
Hero Motocorp
Neutral
3,987
-
79,622
32,239
36,878
16.0
15.6
184.4
206.5
21.6
19.3
6.8
6.0
31.3
30.7
2.3
1.9
Jamna Auto Industries Neutral
231
-
1,844
1,441
1,662
14.4
14.8
13.9
17.6
16.7
13.2
4.5
3.7
30.0
31.0
1.3
1.1
Mahindra and Mahindra Neutral
1,360
-
84,475
46,971
53,816
13.6
14.0
67.7
79.8
20.1
17.0
2.9
2.6
15.0
15.9
1.7
1.4
Maruti
Accumulate
7,570
8,544
228,660
81,825
101,245
15.0
15.0
283.5
356.0
26.7
21.3
5.8
4.8
21.9
22.4
2.5
1.9
Minda Industries
Neutral
825
-
7,130
4,328
5,084
11.0
11.9
27.3
36.4
30.3
22.7
6.4
5.0
23.1
25.6
1.7
1.5
Motherson Sumi
Neutral
309
-
65,071
55,937
64,445
10.8
11.4
16.9
21.1
18.3
14.7
4.1
4.2
25.2
25.4
1.2
1.0
Tata Motors
Neutral
379
-
109,301
303,167
343,649
11.8
13.8
33.1
54.7
11.4
6.9
1.9
1.5
16.9
23.0
0.4
0.3
TVS Motor
Neutral
612
-
29,052
13,992
16,216
9.0
9.4
17.1
20.3
35.9
30.1
9.5
7.4
29.7
27.7
2.0
1.7
Amara Raja Batteries
Accumulate
783
858
13,374
6,140
7,122
14.3
15.6
29.3
39.0
26.7
20.1
4.6
3.8
17.1
19.0
2.2
1.9
Exide Industries
Neutral
196
-
16,673
8,689
9,854
15.1
15.2
9.7
11.0
20.3
17.8
3.6
3.2
15.7
16.1
1.7
1.4
Apollo Tyres
Neutral
248
-
12,639
15,739
17,326
13.3
14.6
20.4
26.7
12.2
9.3
1.5
1.3
20.4
26.7
1.0
0.9
Ceat
Neutral
1,661
-
6,719
6,661
7,717
11.1
14.2
116.2
178.2
14.3
9.3
2.5
2.1
15.2
21.3
1.1
1.0
JK Tyres
Neutral
144
-
3,266
8,318
9,239
16.2
16.4
21.0
27.5
6.9
5.2
1.3
1.1
19.1
20.4
0.8
0.7
Swaraj Engines
Neutral
1,956
-
2,430
788
889
16.4
16.5
71.6
81.0
27.3
24.2
7.9
7.3
29.6
31.0
2.7
2.4
Subros
Neutral
225
-
1,349
1,855
2,135
11.6
11.8
10.3
14.7
21.9
15.3
3.3
2.9
15.8
19.1
0.9
0.8
Capital Goods
BEML
Neutral
1,735
-
7,224
4,286
5,194
7.1
8.2
42.9
58.1
40.4
29.9
3.3
3.0
7.6
8.7
1.7
1.4
Bharat Electronics
Neutral
192
-
42,852
10,258
12,470
19.6
19.5
7.3
8.6
26.3
22.3
0.5
0.5
20.4
21.9
3.7
3.0
Voltas
Neutral
523
-
17,297
6,778
8,004
9.6
11.0
17.1
22.4
30.6
23.3
7.3
6.4
17.7
19.8
2.2
1.9
BHEL
Neutral
128
-
31,268
33,200
39,167
6.8
9.5
6.2
11.2
20.6
11.4
0.9
0.9
4.6
8.0
0.5
0.4
Blue Star
Neutral
754
-
7,224
5,101
5,997
6.0
7.0
17.9
26.6
42.2
28.4
9.0
8.2
21.9
29.0
1.4
1.2
CG Power and Industrial
Neutral
80
-
4,989
6,555
7,292
7.5
7.5
-
0.8
7,960.0
99.5
1.2
1.2
0.1
1.2
0.9
0.8
Solutions
Greaves Cotton
Neutral
149
-
3,646
1,778
1,993
14.7
15.1
8.1
9.1
18.4
16.4
4.1
3.9
21.8
23.6
1.8
1.6
Stock Watch
August 31, 2017
Company Name
Reco
CMP
Target
Mkt Cap
Sales ( Čcr )
OPM(%)
EPS (Č)
PER(x)
P/BV(x)
RoE(%)
EV/Sales(x)
(Č)
Price ( Č)
( Č cr )
FY18E FY19E
FY18E
FY19E
FY18E
FY19E
FY18E
FY19E
FY18E
FY19E
FY18E
FY19E
FY18E
FY19E
Capital Goods
KEC International
Neutral
316
-
8,125
9,779
11,113
9.4
9.8
14.2
18.2
22.3
17.4
4.3
3.5
21.1
22.1
1.1
1.0
KEI Industries
Accumulate
260
290
2,022
3,001
3,391
10.0
10.0
13.0
16.1
20.0
16.1
3.6
3.0
18.2
18.7
0.9
0.8
Thermax
Neutral
880
-
10,483
4,125
4,747
10.3
10.8
26.7
31.5
33.0
27.9
3.7
3.4
11.2
12.0
2.3
2.0
VATech Wabag
Accumulate
606
681
3,309
3,867
4,126
9.6
10.0
34.9
39.8
17.4
15.2
2.9
2.5
17.7
17.5
0.9
0.8
Cement
ACC
Neutral
1,811
-
34,014
12,255
13,350
13.5
14.3
58.0
66.2
31.2
27.4
3.7
3.5
11.5
12.2
2.8
2.5
Ambuja Cements
Neutral
280
-
55,677
10,250
11,450
17.5
19.0
7.2
8.3
38.9
33.8
2.8
2.6
7.0
7.8
5.2
4.6
India Cements
Neutral
174
-
5,359
6,135
6,750
14.8
15.2
8.5
11.5
20.5
15.1
1.0
1.0
4.8
6.2
1.2
1.1
JK Cement
Neutral
1,008
-
7,049
4,150
4,775
19.2
20.0
49.0
63.5
20.6
15.9
3.3
2.8
17.0
18.5
2.1
1.8
J K Lakshmi Cement
Neutral
418
-
4,923
3,422
3,757
15.5
17.0
13.5
23.2
31.0
18.0
3.2
2.8
10.8
15.5
1.8
1.6
Orient Cement
Neutral
152
-
3,107
2,215
3,233
16.8
17.0
5.9
6.9
25.7
22.0
2.0
1.8
10.8
10.1
2.4
1.6
UltraTech Cement
Neutral
4,008
-
110,017
28,250
35,150
20.2
23.5
77.5
122.2
51.7
32.8
4.4
4.0
9.6
14.8
4.4
3.5
Construction
KNR Constructions
Neutral
211
-
2,967
1,846
2,203
14.5
14.5
12.1
13.7
17.4
15.5
1.0
0.8
17.5
16.7
1.7
1.4
Larsen & Toubro
Neutral
1,140
-
159,648
95,787
109,476
10.2
11.6
44.5
50.8
25.6
22.5
3.2
3.0
12.9
13.1
2.2
2.0
Gujarat Pipavav Port
Neutral
128
-
6,207
739
842
61.6
62.7
5.1
6.2
25.2
20.9
3.1
3.1
12.7
14.9
7.9
6.8
PNC Infratech
Neutral
137
-
3,524
2,040
2,935
13.0
13.0
6.4
9.0
21.5
15.3
0.6
0.5
9.7
12.2
1.7
1.3
Simplex Infra
Neutral
488
-
2,414
6,012
6,619
11.6
11.7
21.1
31.0
23.2
15.8
1.6
1.5
6.5
8.6
0.9
0.8
Sadbhav Engineering
Accumulate
278
298
4,772
3,823
4,426
10.7
10.8
10.3
11.8
27.0
23.6
3.2
2.8
10.1
10.5
1.6
1.4
NBCC
Neutral
206
-
18,576
9,099
12,706
6.4
6.4
7.3
9.6
28.4
21.6
1.3
1.0
27.5
30.5
1.9
1.4
MEP Infra
Neutral
115
-
1,867
2,403
2,910
18.3
16.8
2.4
6.1
48.8
18.9
18.5
12.5
35.2
55.8
1.9
1.6
SIPL
Neutral
101
-
3,565
2,060
2,390
46.8
47.7
(5.8)
(3.1)
3.8
4.3
(14.2)
(2.3)
6.5
6.1
Engineers India
Neutral
157
-
10,560
1,795
2,611
21.1
22.4
5.9
8.1
26.6
19.4
1.9
1.8
12.9
16.1
4.3
2.8
Financials
Axis Bank
Accumulate
505
580
120,996
32,558
35,843
3.5
3.2
27.8
41.0
18.2
12.3
2.0
1.7
11.4
14.9
-
-
Bank of Baroda
Neutral
139
-
32,132
22,533
26,079
2.4
2.4
12.0
20.9
11.6
6.7
0.8
0.7
6.6
11.0
-
-
Canara Bank
Neutral
339
-
20,239
17,925
20,235
2.0
2.1
18.5
36.5
18.3
9.3
0.7
0.7
3.4
6.2
-
-
Can Fin Homes
Neutral
2,795
-
7,441
586
741
3.5
3.5
107.8
141.0
25.9
19.8
5.7
4.6
24.1
25.6
-
-
Cholamandalam Inv. &
Neutral
1,181
-
18,459
2,826
3,307
6.3
6.3
53.7
64.6
22.0
18.3
3.8
3.2
18.3
18.9
-
-
Fin. Co.
Dewan Housing Finance Neutral
503
-
15,784
2,676
3,383
2.4
2.7
37.4
49.7
13.5
10.1
1.8
1.5
13.8
16.2
-
-
Equitas Holdings
Buy
169
235
5,712
1,125
1,380
9.6
9.8
1.5
6.0
112.4
28.1
2.6
2.4
2.4
8.2
-
-
Federal Bank
Accumulate
109
125
21,176
4,896
5,930
2.8
3.1
5.4
7.6
20.3
14.4
1.7
1.6
8.5
11.0
-
-
Stock Watch
August 31, 2017
Company Name
Reco
CMP
Target
Mkt Cap
Sales ( Čcr )
OPM(%)
EPS (Č)
PER(x)
P/BV(x)
RoE(%)
EV/Sales(x)
(Č)
Price ( Č)
( Č cr )
FY18E FY19E
FY18E
FY19E
FY18E
FY19E
FY18E
FY19E
FY18E
FY19E
FY18E
FY19E
FY18E
FY19E
Financials
HDFC Bank
Neutral
1,769
-
455,543
55,236
63,253
4.5
4.4
68.9
82.4
25.7
21.5
4.5
3.7
18.7
18.5
-
-
ICICI Bank
Neutral
300
-
192,661
42,361
51,378
3.6
3.9
18.4
25.7
16.3
11.7
1.8
1.7
11.3
15.0
-
-
Karur Vysya Bank
Accumulate
141
160
8,539
3,289
3,630
3.7
3.9
10.8
14.1
13.0
10.0
1.6
1.4
12.5
14.7
-
-
LIC Housing Finance
Neutral
663
-
33,462
4,895
6,332
3.4
3.7
50.7
66.8
13.1
9.9
2.6
2.2
21.7
23.8
-
-
Punjab Natl.Bank
Neutral
142
-
30,281
23,708
25,758
2.1
2.1
5.9
16.4
24.2
8.7
0.7
0.7
3.0
8.3
-
-
RBL Bank
Neutral
538
-
20,390
2,309
2,888
2.6
2.5
16.4
19.1
32.9
28.2
4.1
3.7
13.3
13.8
-
-
Repco Home Finance
Buy
650
825
4,064
496
597
4.4
4.2
38.5
48.7
16.9
13.3
3.0
2.5
19.6
20.6
-
-
South Ind.Bank
Neutral
28
-
5,052
3,195
3,567
3.0
3.1
3.0
3.8
9.3
7.3
0.9
0.8
10.5
11.9
-
-
St Bk of India
Neutral
277
-
239,021
105,827
121,056
2.4
2.5
16.1
25.6
17.2
10.8
1.4
1.2
6.6
9.9
-
-
Union Bank
Neutral
136
-
9,377
14,650
16,225
2.3
2.3
23.1
32.5
5.9
4.2
0.5
0.4
7.1
9.2
-
-
Yes Bank
Neutral
1,750
-
80,111
11,088
13,138
3.0
2.9
84.0
99.3
20.8
17.6
3.2
2.8
16.3
16.8
-
-
FMCG
Akzo Nobel India
Neutral
1,800
-
8,633
3,164
3,607
13.8
13.7
58.6
67.9
30.7
26.5
7.5
6.7
24.5
25.1
2.6
2.2
Asian Paints
Neutral
1,153
-
110,624
17,603
20,615
18.6
18.6
2,128.9
2,543.3
0.5
0.5
11.4
9.6
28.0
28.9
6.1
5.1
Britannia
Neutral
4,244
-
50,958
9,690
11,278
14.8
15.4
84.0
101.0
50.5
42.0
18.4
14.6
40.6
39.0
5.2
4.5
Colgate
Neutral
1,105
-
30,049
4,420
5,074
24.9
25.3
28.6
32.8
38.6
33.7
15.2
12.3
43.8
40.5
6.5
5.7
Dabur India
Neutral
315
-
55,435
8,346
9,344
19.6
19.9
7.8
9.0
40.4
35.0
8.1
7.4
25.2
24.8
6.2
5.5
GlaxoSmith Con*
Neutral
5,365
-
22,563
5,072
5,760
18.2
18.4
176.3
199.2
30.4
26.9
6.5
5.8
21.2
21.7
3.8
3.3
Godrej Consumer
Neutral
924
-
62,982
10,171
11,682
20.8
21.5
21.7
27.1
42.6
34.1
9.6
8.2
22.3
23.4
6.3
5.4
HUL
Neutral
1,204
-
260,569
37,077
41,508
20.3
21.8
5,189.9
6,318.5
0.2
0.2
36.7
31.4
74.8
82.0
6.9
6.1
ITC
Neutral
282
-
343,851
44,588
49,853
37.0
37.3
9.6
11.0
29.4
25.7
7.2
6.9
25.1
27.3
7.2
6.4
Marico
Neutral
314
-
40,521
6,788
7,766
18.5
19.2
7.1
8.5
44.2
36.9
15.5
13.3
36.9
38.0
5.8
5.1
Nestle*
Neutral
7,022
-
67,707
10,083
11,182
20.0
20.9
119.7
141.3
58.7
49.7
206.8
189.0
36.7
39.8
6.4
5.7
Tata Global
Neutral
197
-
12,436
7,121
7,641
11.9
12.3
6.9
8.0
28.6
24.6
1.9
1.8
6.8
7.2
1.5
1.4
Procter & Gamble
Neutral
8,295
-
26,926
3,034
3,579
27.1
27.7
167.7
198.8
49.5
41.7
13.3
11.4
28.8
29.5
8.3
6.9
Hygiene
IT
HCL Tech^
Buy
850
1,014
121,301
52,342
57,053
20.9
20.9
62.8
67.6
13.5
12.6
3.0
2.6
22.4
20.6
2.0
1.7
Infosys
Buy
927
1,179
212,848
73,963
80,619
26.0
26.0
64.4
69.3
14.4
13.4
2.8
2.6
19.7
19.6
2.3
2.1
TCS
Accumulate
2,487
2,651
489,996
127,403
138,870
27.6
27.6
144.5
156.0
17.2
15.9
5.1
4.8
29.7
29.8
3.5
3.2
Tech Mahindra
Buy
426
533
41,531
31,015
33,496
15.0
15.0
35.6
38.1
12.0
11.2
2.0
1.9
17.0
16.3
1.1
1.0
Wipro
Neutral
292
-
141,930
58,536
61,858
20.3
20.3
18.2
19.1
16.0
15.3
2.5
2.2
14.6
13.4
2.4
2.2
Stock Watch
August 31, 2017
Company Name
Reco
CMP
Target
Mkt Cap
Sales ( Čcr )
OPM(%)
EPS (Č)
PER(x)
P/BV(x)
RoE(%)
EV/Sales(x)
(Č)
Price ( Č)
( Č cr )
FY18E FY19E
FY18E
FY19E
FY18E
FY19E
FY18E
FY19E
FY18E
FY19E
FY18E
FY19E
FY18E
FY19E
Media
D B Corp
Neutral
370
-
6,809
2,404
2,625
30.5
31.5
23.7
26.9
15.6
13.8
3.7
3.1
23.5
22.8
2.7
2.4
HT Media
Neutral
90
-
2,103
2,589
2,830
15.1
15.4
8.3
10.9
10.9
8.3
0.9
0.8
8.4
10.4
0.4
0.2
Jagran Prakashan
Buy
174
225
5,683
2,541
2,835
28.5
28.7
12.7
14.1
13.7
12.3
2.8
2.5
21.3
21.4
2.1
1.8
Sun TV Network
Neutral
705
-
27,765
3,238
3,789
51.9
55.1
30.9
38.0
22.8
18.5
6.5
5.7
30.0
31.0
8.1
6.8
Hindustan Media
Neutral
268
-
1,969
1,002
1,074
23.3
23.5
29.2
33.8
9.2
7.9
1.4
1.2
15.6
15.4
1.0
0.7
Ventures
TV Today Network
Buy
243
344
1,450
667
727
27.7
27.7
18.6
20.1
13.1
12.1
2.0
2.1
15.6
17.3
1.7
1.6
Music Broadcast Limited Buy
373
434
2,128
271
317
91.0
109.0
6.0
10.0
62.2
37.3
3.9
3.5
6.5
9.3
7.4
6.1
Metals & Mining
Coal India
Neutral
242
-
149,909
82,301
91,235
17.0
18.0
17.1
20.5
14.1
11.8
2.7
2.5
45.0
55.0
1.5
1.3
Hind. Zinc
Neutral
295
-
124,436
22,108
24,555
57.0
58.0
22.1
26.3
13.3
11.2
4.3
3.5
32.0
35.0
4.6
3.8
Hindalco
Neutral
236
-
53,048
102,350
105,355
13.5
14.5
21.5
24.5
11.0
9.7
1.5
1.3
15.0
15.2
1.1
1.0
JSW Steel
Neutral
259
-
62,594
64,500
68,245
21.1
21.5
20.1
21.2
12.9
12.2
2.4
2.0
-
-
1.7
1.6
NMDC
Neutral
126
-
39,976
10,209
11,450
47.0
48.0
11.1
12.1
11.4
10.4
1.6
1.5
-
-
3.4
3.1
SAIL
Neutral
62
-
25,524
54,100
63,555
3.0
10.0
(10.0)
1.5
41.2
0.8
0.8
-
-
1.5
1.3
Vedanta
Neutral
306
-
113,579
81,206
87,345
28.0
29.0
26.5
33.5
11.5
9.1
2.6
2.3
-
-
2.1
1.8
Tata Steel
Neutral
639
-
62,027
121,445
126,500
16.2
17.2
65.4
81.3
9.8
7.9
1.6
1.3
-
-
1.0
0.9
Oil & Gas
GAIL
Neutral
381
-
64,405
53,115
52,344
14.2
15.3
30.0
31.1
12.7
12.2
1.6
1.5
-
-
0.9
0.9
ONGC
Neutral
159
-
203,535
83,111
84,934
44.2
44.9
16.4
16.9
9.7
9.4
1.2
1.1
-
-
2.3
2.3
Indian Oil Corp
Neutral
453
-
219,900
396,116
432,560
8.5
8.8
40.1
42.2
11.3
10.7
2.0
1.8
-
-
0.7
0.6
Reliance Industries
Neutral
1,564
-
508,646
257,711
267,438
17.0
18.2
89.1
89.5
17.6
17.5
1.6
1.5
-
-
1.6
1.6
Pharmaceuticals
Alembic Pharma
Buy
507
600
9,555
3,903
4,584
18.2
19.2
21.8
27.2
23.3
18.6
4.2
3.5
19.8
20.6
2.5
2.1
Alkem Laboratories Ltd
Buy
1,776
2,161
21,230
6,901
7,850
18.4
19.1
85.0
100.5
20.9
17.7
4.2
3.6
20.2
20.1
3.1
2.7
Aurobindo Pharma
Accumulate
736
823
43,112
17,086
19,478
22.1
22.0
44.7
51.4
16.5
14.3
3.6
2.9
24.7
22.7
2.6
2.3
Aventis*
Neutral
3,948
-
9,093
2,508
2,862
16.8
16.8
139.9
153.8
28.2
25.7
4.1
3.3
23.5
25.8
3.2
2.7
Cadila Healthcare
Sell
504
426
51,597
11,584
13,228
20.3
20.4
18.7
21.3
27.0
23.7
6.0
4.9
24.6
22.9
4.3
3.7
Cipla
Sell
567
458
45,614
16,619
19,437
15.4
16.2
19.7
24.3
28.8
23.3
3.3
2.9
12.0
13.2
2.9
2.5
Dr Reddy's
Accumulate
2,040
2,219
33,820
15,844
17,973
17.6
18.2
91.7
111.0
22.3
18.4
2.5
2.3
11.9
13.0
2.3
2.1
GSK Pharma*
Neutral
2,422
-
20,512
3,260
3,651
15.0
18.0
46.1
58.6
52.5
41.3
10.8
11.1
20.0
26.5
6.2
5.6
Indoco Remedies
Sell
192
153
1,765
1,154
1,310
14.9
14.9
11.3
12.7
17.0
15.1
2.4
2.1
15.0
15.0
1.7
1.4
Ipca labs
Buy
417
540
5,266
3,593
4,022
14.5
15.5
19.4
25.2
21.5
16.6
2.0
1.8
9.5
11.2
1.5
1.4
Stock Watch
August 31, 2017
Company Name
Reco
CMP
Target
Mkt Cap
Sales ( Čcr )
OPM(%)
EPS (Č)
PER(x)
P/BV(x)
RoE(%)
EV/Sales(x)
(Č)
Price ( Č)
( Č cr )
FY18E FY19E
FY18E
FY19E
FY18E
FY19E
FY18E
FY19E
FY18E
FY19E
FY18E
FY19E
FY18E
FY19E
Pharmaceuticals
Lupin
Buy
987
1,467
44,588
18,657
21,289
21.3
23.3
52.8
66.7
18.7
14.8
2.8
2.4
16.3
17.5
2.4
2.0
Natco Pharma
Accumulate
721
796
12,574
1,836
1,946
31.8
28.9
22.1
20.6
32.6
35.0
6.6
5.8
20.1
16.7
6.7
6.3
Sun Pharma
Buy
484
558
116,076
32,899
36,451
26.9
25.4
31.6
32.3
15.3
15.0
2.7
2.3
18.7
18.8
3.2
2.7
Syngene International
Buy
442
557
8,846
1,402
1,823
32.8
36.0
15.9
20.7
27.9
21.4
5.2
4.3
18.7
20.0
6.3
4.8
Power
Tata Power
Neutral
78
-
21,003
32,547
33,806
20.5
20.5
4.7
5.4
16.5
14.5
1.6
1.4
10.5
10.5
1.6
1.6
NTPC
Neutral
168
-
138,524
86,070
101,246
28.3
30.7
12.9
16.2
13.0
10.4
1.3
1.2
10.6
12.4
3.0
2.7
Power Grid
Neutral
216
-
112,924
29,183
32,946
89.7
90.0
18.0
20.8
12.0
10.4
2.0
1.8
17.7
18.2
7.8
7.2
Real Estate
Prestige Estate
Neutral
270
-
10,138
4,607
5,146
21.0
22.2
7.9
9.8
34.2
27.6
2.1
2.0
10.3
12.0
3.4
3.1
MLIFE
Buy
433
522
2,222
487
590
12.3
17.8
21.0
31.2
20.6
13.9
1.1
1.0
5.2
7.4
3.3
2.7
Telecom
Bharti Airtel
Neutral
429
-
171,568
97,903
105,233
36.0
36.3
9.3
11.1
46.2
38.8
2.2
2.1
5.0
5.6
2.7
2.4
Idea Cellular
Neutral
88
-
31,720
35,012
37,689
27.1
27.7
(4.4)
(2.7)
1.4
1.4
(6.8)
(4.6)
2.2
2.0
zOthers
Abbott India
Neutral
4,250
-
9,030
3,244
3,723
14.9
16.1
167.5
209.4
25.4
20.3
5.6
4.7
23.7
24.8
2.4
2.0
Asian Granito
Accumulate
440
480
1,324
1,169
1,286
12.5
12.5
16.0
19.7
27.5
22.3
2.9
2.6
10.7
11.6
1.4
1.2
Bajaj Electricals
Buy
343
395
3,475
4,646
5,301
6.7
7.6
16.1
22.3
21.3
15.4
3.5
3.0
16.4
19.2
0.7
0.7
Banco Products (India)
Neutral
213
-
1,521
1,530
1,695
13.2
12.7
19.0
20.0
11.2
10.6
1.8
1.6
0.2
0.2
0.9
100.3
Coffee Day Enterprises
Neutral
239
-
4,929
3,494
3,913
17.4
18.0
4.8
5.7
-
42.0
2.1
2.0
-
0.1
1.9
1.6
Ltd
Elecon Engineering
Neutral
48
-
536
171
201
15.0
16.2
36.0
43.0
1.3
1.1
0.1
0.1
0.1
0.1
2.5
2.1
Garware Wall Ropes
Neutral
857
-
1,876
928
1,003
15.2
15.2
39.4
43.2
21.7
19.9
3.6
3.1
16.5
15.4
1.9
1.7
Goodyear India*
Neutral
822
-
1,896
1,717
1,866
11.8
12.3
47.9
49.8
17.2
16.5
2.7
2.3
15.6
15.7
0.8
114.4
Hitachi
Neutral
1,945
-
5,289
2,355
2,715
10.3
10.8
49.0
60.9
39.7
31.9
9.3
7.4
0.2
0.2
2.3
2.0
HSIL
Neutral
378
-
2,734
2,240
2,670
14.6
15.0
17.0
22.0
22.2
17.2
1.8
1.7
0.1
0.1
1.4
1.2
Interglobe Aviation
Neutral
1,194
-
43,191
22,570
27,955
14.2
15.0
63.6
81.8
18.8
14.6
9.9
8.3
0.5
0.6
1.6
1.2
Jyothy Laboratories
Neutral
380
-
6,903
1,781
2,044
14.1
15.0
9.4
10.5
40.6
36.2
8.7
8.1
0.2
0.2
4.1
3.5
Linc Pen & Plastics
Neutral
241
-
356
420
462
9.3
9.3
15.3
17.1
15.7
14.1
2.7
2.7
16.9
19.5
0.9
0.8
M M Forgings
Neutral
588
-
710
542
642
20.1
21.0
41.6
56.8
14.1
10.4
2.0
1.7
0.1
0.2
1.7
1.5
Mirza International
Neutral
158
-
1,897
1,148
1,285
18.0
18.0
8.0
9.4
19.6
16.9
3.3
2.7
16.3
16.1
1.8
1.6
Navkar Corporation
Buy
195
265
2,777
561
617
41.5
41.5
11.5
12.7
16.9
15.3
1.8
1.6
10.5
10.4
5.6
4.9
Nilkamal
Neutral
1,558
-
2,325
2,317
2,525
11.4
11.1
96.0
105.0
16.2
14.8
2.8
2.4
0.2
0.2
1.0
0.9
Parag Milk Foods
Neutral
246
-
2,065
1,987
2,379
7.6
9.0
12.4
18.3
19.8
13.4
2.8
2.4
8.2
13.2
1.2
1.0
Stock Watch
August 31, 2017
Company Name
Reco
CMP
Target Mkt Cap
Sales ( Čcr )
OPM(%)
EPS (Č)
PER(x)
P/BV(x)
RoE(%)
EV/Sales(x)
(Č)
Price ( Č)
( Č cr )
FY18E FY19E FY18E FY19E FY18E FY19E FY18E FY19E FY18E FY19E FY18E FY19E FY18E FY19E
zOthers
Radico Khaitan
Neutral
168
-
2,233
1,811
1,992
13.2
13.2
8.1
8.8
20.7
19.1
2.1
2.3
10.1
12.0
1.6
1.4
Relaxo Footwears
Neutral
503
-
6,046
1,981
2,310
13.7
14.5
12.0
15.5
41.9
32.5
8.2
6.6
0.2
0.2
3.1
2.7
Siyaram Silk Mills
Accumulate
2,196
2,500
2,058
1,769
1,981
12.7
12.7
113.1
131.1
19.4
16.7
3.0
2.6
15.5
15.5
1.3
1.2
Styrolution ABS India* Neutral
896
-
1,575
1,800
1,980
8.0
8.1
42.0
46.2
21.3
19.4
2.4
2.1
0.1
0.1
1.0
0.9
Surya Roshni
Neutral
286
-
1,256
4,870
5,320
7.7
7.8
22.8
28.1
12.6
10.2
1.7
1.4
0.1
0.1
0.5
0.4
TVS Srichakra
Neutral
3,316
-
2,539
2,729
2,893
12.7
12.5
248.5
265.0
13.3
12.5
3.8
3.1
0.3
0.3
0.9
0.9
Visaka Industries
Neutral
679
-
1,078
1,104
1,214
12.1
12.6
31.0
37.9
21.9
17.9
2.7
2.4
0.1
0.1
1.2
1.1
VIP Industries
Accumulate
220
250
3,110
1,450
1,693
10.4
10.5
6.5
7.8
33.6
28.2
7.1
6.2
21.1
22.1
2.1
1.8
Navin Fluorine
Accumulate
662
730
3,260
945
1,154
22.4
22.6
28.7
34.8
23.1
19.0
3.8
3.3
-
-
3.0
2.3
Source: Company, Angel Research; Note: *December year end; #September year end; &October year end; Price as on August 30, 2017
Market Outlook
August 31, 2017
Research Team Tel: 022 - 39357800
DISCLAIMER
Angel Broking Private Limited (hereinafter referred to as “Angel”) is a registered Member of National Stock Exchange of India
Limited,Bombay Stock Exchange Limited and Metropolitan Stock Exchange Limited. It is also registered as a Depository Participant with
CDSL and Portfolio Manager with SEBI. It also has registration with AMFI as a Mutual Fund Distributor. Angel Broking Private Limited is a
registered entity with SEBI for Research Analyst in terms of SEBI (Research Analyst) Regulations, 2014 vide registration number
INH000000164. Angel or its associates has not been debarred/ suspended by SEBI or any other regulatory authority for accessing
/dealing in securities Market. Angel or its associates/analyst has not received any compensation / managed or
co-managed public offering of securities of the company covered by Analyst during the past twelve months.
This document is solely for the personal information of the recipient, and must not be singularly used as the basis of any investment
decision. Nothing in this document should be construed as investment or financial advice. Each recipient of this document should make
such investigations as they deem necessary to arrive at an independent evaluation of an investment in the securities of the companies
referred to in this document (including the merits and risks involved), and should consult their own advisors to determine the merits and
risks of such an investment.
Reports based on technical and derivative analysis center on studying charts of a stock's price movement, outstanding positions and
trading volume, as opposed to focusing on a company's fundamentals and, as such, may not match with a report on a company's
fundamentals. Investors are advised to refer the Fundamental and Technical Research Reports available on our website to evaluate the
contrary view, if any.
The information in this document has been printed on the basis of publicly available information, internal data and other reliable
sources believed to be true, but we do not represent that it is accurate or complete and it should not be relied on as such, as this
document is for general guidance only. Angel Broking Pvt. Limited or any of its affiliates/ group companies shall not be in any way
responsible for any loss or damage that may arise to any person from any inadvertent error in the information contained in this report.
Angel Broking Pvt. Limited has not independently verified all the information contained within this document. Accordingly, we cannot
testify, nor make any representation or warranty, express or implied, to the accuracy, contents or data contained within this document.
While Angel Broking Pvt. Limited endeavors to update on a reasonable basis the information discussed in this material, there may be
regulatory, compliance, or other reasons that prevent us from doing so.
This document is being supplied to you solely for your information, and its contents, information or data may not be reproduced,
redistributed or passed on, directly or indirectly.
Neither Angel Broking Pvt. Limited, nor its directors, employees or affiliates shall be liable for any loss or damage that may arise from
or in connection with the use of this information.